
This blog post provides some tips for Elasticsearch and Kibana Search Speed Tuning, apart from those recommended by Elasticsearch official website [1]:
- giving enough memory to the filesystem cache
- using faster hardware
- searching as few fields as possible
- pre-indexing data
- avoiding scripts
- considering mapping identifiers as keywords
- etc.
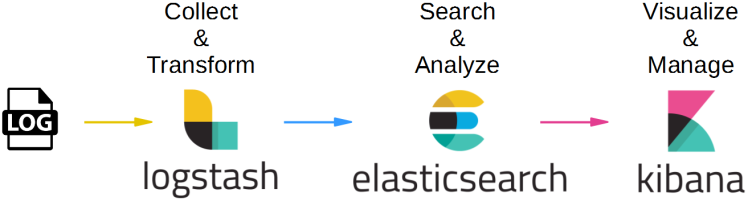
ELK Stack
I recently installed the ELK Stack (Elasticsearch, Logstash and Kibana) on a single node cluster (m4.large EC2 instance type) to analyze Amazon S3 and CloudFront logs, and tried to improve search speed (I’ll not discuss indexing speed in this post). In production it’s recommended to have at least 3 nodes for a better performance, so I had to do some more tuning, in addition to the above.
1. Shard Allocation
The shards are the data containers for Elasticsearch and the number of shards have the effect on the performance of ES cluster. Since a shard is essentially a Lucene index, it consumes file handles, memory, and CPU resources. If there is a large number of shards, it will use too much resources from the cluster to manage the cluster activities; the cluster will have a large cluster state table and each search request has to touch a copy of every shard in the indexes, this will be a resource consuming process for the cluster. Also, the more shards the Elasticsearch cluster has, the more likely you are to get the “courier fetch error”.
If indexes are less than 30GB in size, 1 shard (primary) per index would be enough. Index Template [2] can be used to set a default for all indices as follows:
1.1. Check the number of shards and indices in the cluster by calling the _cat API operation
GET _cat/indices/logstash*
1.2. Define an index template, which specifies the number of shards for all new indices that will be created in the cluster, i.e.:
POST _template/default

{

"index_patterns": ["*"],

"settings": {

"number_of_shards": "1",

"number_of_replicas": "0"

}

}
1.3. Re-index by calling the _reindex API operation (this will move the data to a new index with the number of shards that was specified in the index template)
POST _reindex

{

"source": {

"index": "logstash-2019.02.06"

},

"dest": {

"index": "logstash-2019.02.06.new"

}

}
2. JVM Memory pressure and Heap Sizing
In Elasticsearch, JVM memory pressure indicates the fill rate of the old generation pool. Two common factors jointly contribute to the JVM memory pressure: the amount of data on the cluster, and the workload on the cluster (based on the cluster’s size). The full Java Garbage Collection can stop all the operation in the node, it also takes a lot of resources to the cluster (CPU, memory, etc.) when it is in action. It’s recommended to keep JVM Memory Pressure to around 70% [3].
- When the heap size reaches 75%, Elasticsearch uses Concurrent Mark and Sweep (CMS) as default garbage collector(GC) to de-allocate space on the heap. This algorithm happens concurrently with other operations.
- If previous GC operations have not restored enough memory and utilization is still above 75%, ES temporarily halts or slows processing of other threads to free memory using a different algorithm for GC. This compounds problems in the cluster as requests are backlogged, but it is necessary because otherwise an OOM error would occur quickly.
- When the heap size is near 95%, ElasticSearch will kill the thread of the process that is trying to allocate memory. Because memory is a common resource, it is not guaranteed that this action won’t kill a critical process.
The less heap memory is allocated to Elasticsearch, the more RAM remains available for other OS processes and Lucene, which relies heavily on the file system cache to serve requests quickly. It’s recommended to set the Heap Size to around 30% ~ 60% of available memory and monitor the JMV Heap, make sure it’s less than 75%.
To set the minimum and maximum JVM Heap sizes, change the values of -Xms and –Xmx in jvm.options respectively, environment variables can also be used; it’s recommended to have the same value for -Xms and -Xmx [4].
3. Swapping
Given the memory used by ELK Stack, a Swap memory [5] can be added to the server (if there is no swap) and disable Swap utilization for Elasticsearch; swapping makes things slow as disks are slower than the memory [4]. This property can be set in the YAML file:
bootstrap.memory_lock: true
4. Kibana Dashboards
Use a single dashboard per page, containing different visualizations. Indeed, Kibana sends all queries related to Visualizations in a Dashboard in a single _msearch request, which executes in parallel. When a page has different dashboards, requests are sent individually, causing some visualizations to be rendered a bit quickly, but the entire dashboard as a whole to be rendered more slowly (from start to finish). This should be a bad experience if the user is on a slow connection, some dashboards might never load. Another drawback of having different dashboards on a single page is that it requires more ES resources, increasing the server Memory and CPU Utilization.
5. Refresh Interval (5s by default)
Elasticsearch creates new segment every time a refresh happens. Increasing the refresh interval would help reduce the segment count and reduce the IO cost for search. And, the cache would be invalid once a refresh happens and data is changed. Increasing the refresh interval can make Elasticsearch utilize cache more efficiently. To increase the Refresh Interval:
PUT /logstash-2019.02.06/_settings

{

"index" : {

"refresh_interval" : "60s"

}

}
6. Shard Request Cache
The shard-level request cache module caches the local results on each shard, which allows frequently used search requests to return results almost instantly. To increase (decrease) it size change indices.requests.cache.size in Elasticsearch configuration file:
indices.requests.cache.size: 10%
The request below can be used to check whether the shard query cache has an effect:
GET logstash*/_stats/request_cache?human
It should display something like the following
***

"_all": {

"primaries": {

"request_cache": {

"memory_size": "17.1mb",

"memory_size_in_bytes": 17975017,

"evictions": 0,

"hit_count": 8915,

"miss_count": 1955

}

},

"total": {

"request_cache": {

"memory_size": "17.1mb",

"memory_size_in_bytes": 17975017,

"evictions": 0,

"hit_count": 8915,

"miss_count": 1955

}

}

},

***
7. Use Filter Context instead of Query Context
Some visualizations on the current dashboards are based on queries. It’s recommended, whenever possible, to use Filter Context, as frequently used filters are cached automatically to speed up performance [5].
References:
[1] Tune Elasticsearch for Search Speed
[2] Indice Template
[3] Memory Pressure Indicator
[4] Heap – Sizing and Swapping
[5] Query and filter context
1 comment
Thanks-a-mundo for the post.Thanks Again. Awesome.